An updated set of Grafana dashboards for Kubernetes
This article was originally published on Medium.
Introduction
Two years ago, I published A set of modern Grafana dashboards for Kubernetes to share the dashboards I created for Kubernetes with the community. In this article, I’ll provide an update on the project and walk through the main changes that have been made since then.
Project’s updates
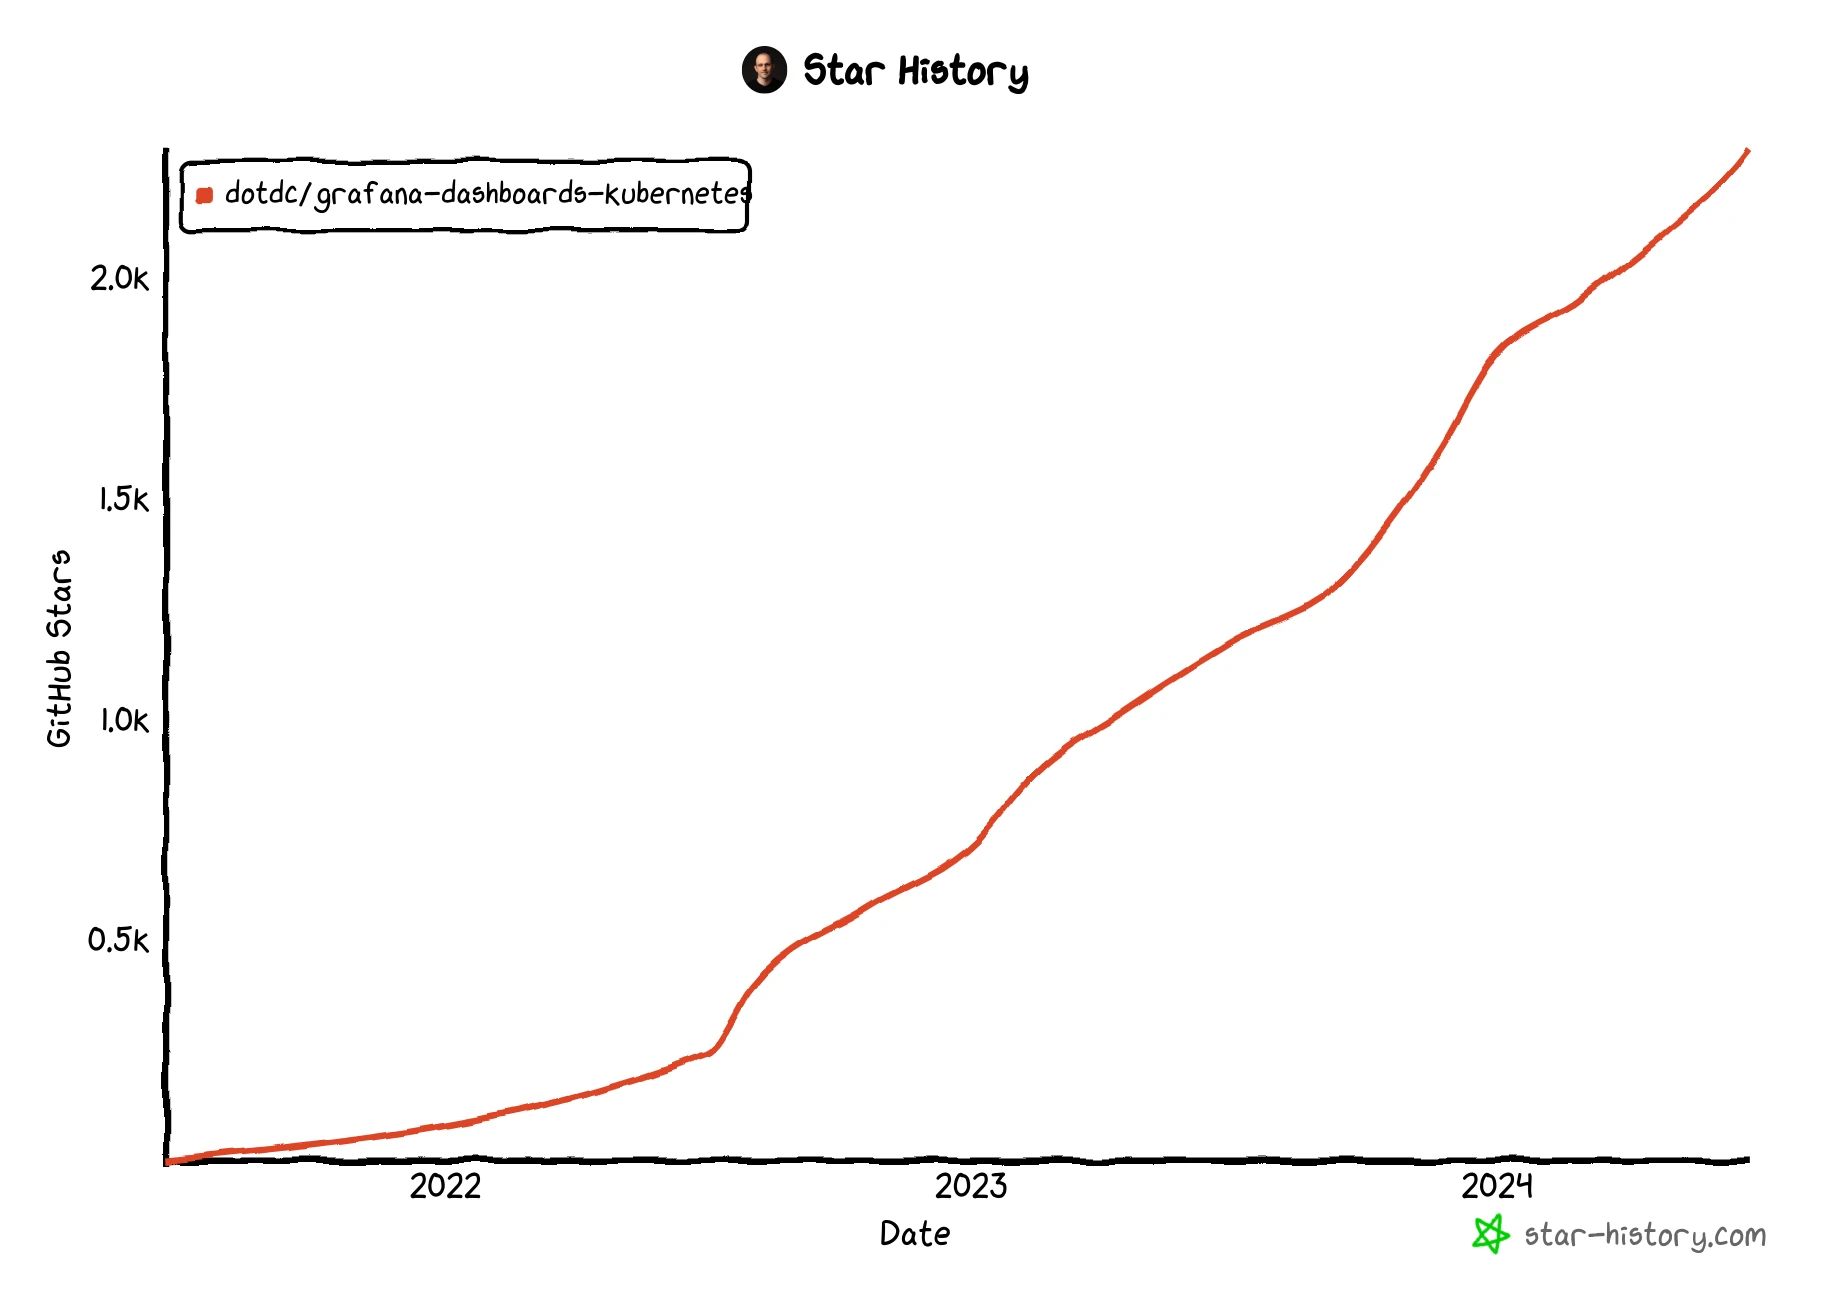
The dotdc/grafana-dashboards-kubernetes project has evolved significantly over the last two years! Following several retweets, both the original article and the project saw a noticeable increase in traffic, which also brought several new contributors. I was surprised to see so many people from all around the world using my dashboards in their home labs or in companies such as Rakuten, Orange, Swisscom, and Nokia. Some projects even directly embedded the dashboards, such as Victoria Metrics, the GCP Cloud Foundation Fabric and the Microsoft Azure Arc Jumpstart.
Here are the current project statistics:
- ~5 million dashboards downloads (grafana.com only!)
- 2293 GitHub stars
- 337 forks
- 26 contributors
Changes
General changes
Following community demand, the project now has proper releases that are automatically generated using a semantic releaser, which leverages conventional commits to create versions following semantic versioning.
Additionally, all dashboards now include a cluster variable support, which was implemented with a safe and straightforward solution as documented in issue #15.
This enables users of tools like Thanos, Mimir, or any other federated or highly available setups to enjoy enhanced compatibility.
Furthermore, new panels have been added to visualize CPU throttling across all “views” dashboards.
k8s-views-pods.json
Building on ideas from issue #21 and further work, k8s-views-pods.json has received a major update! Among the changes are several new information panels displaying priority class, QoS class, last terminated reason, and last terminated exit code.
Additionally, two new panels have been added: one compares CPU requests and limits to actual CPU usage, and the other does the same for memory. This helps to better visualize container resource usage and simplifies container sizing.

k8s-addons-prometheus.json
The project now includes a dashboard for Prometheus with panels related to Prometheus instances, TSDB, query engine, resources, storage, and network.

k8s-addons-trivy-operator.json
The k8s-addons-starboard-operator.json which used the Giant Swarm starboard-exporter has been replaced in favor of k8s-addons-trivy-operator.json, based on metrics from the trivy-operator of Aqua Security.

Changelog
k8s-views-global.json:
k8s-views-namespaces.json:
- added throttled cpu panels (dbf01b1)
- ability to filter on a specific deployments, statefulsets or deamonsets (d173be7)
- added cluster variable (7ac58e5)
k8s-views-nodes.json:
k8s-views-pods.json:
- rework the pods dashboard with ideas (9d11d49)
- added throttled cpu panels (d223755)
- added links from pods to nodes (df42ae5)
- added oom and restarts (ab62016)
- added cluster variable (7ac58e5)
- added multi pod select (03281bf)
Other changes:
Final words
I hope that this article was useful and that it gave additional information over the original article!
It has been truly rewarding to receive feedback, compliments, ideas, and engage in technical discussions with the community. This ultimately led me to join the Grafana Champion program. Thank you! ❤️
Your feedback and suggestions are always welcome, so feel free to contribute to this project:
- Give a GitHub ⭐ if you like it
- Create an Issue to make a feature request, report a bug or share an idea.
- Create a Pull Request if you want to share code or anything useful to this project.
You can also follow me on:
- GitHub : https://github.com/dotdc
- LinkedIn : https://www.linkedin.com/in/0xDC
- Bluesky : https://bsky.app/profile/0xdc.me
- Twitter : https://twitter.com/0xDC_
- Mastodon : https://hachyderm.io/@0xDC
👋